
Global Site
Breadcrumb navigation
Millimeter-level Anomalies and Degradation detected using Satellites
Bridge displacement analysis technology using SAR and AI
Featured Technologies September 26, 2022

Now, there are roughly 720,000 bridges installed in Japan. Most of them were developed during the period of high economic growth and are degrading as time passes. In 2021, the Musota water pipe bridge in Wakayama Prefecture collapsed.
By law, bridges are required to be visually inspected once every five years, but there is a critical shortage of inspection personnel, and it is hoped that inspection should be improved in its efficiency through the introduction of new technology, etc. The satellite SAR (synthetic aperture radar) technology recently announced by NEC addresses this problem. We have interviewed in depth several researchers about how this technology detects anomalies in bridges.
Detecting bridge anomalies from the air to identify bridges which require inspection

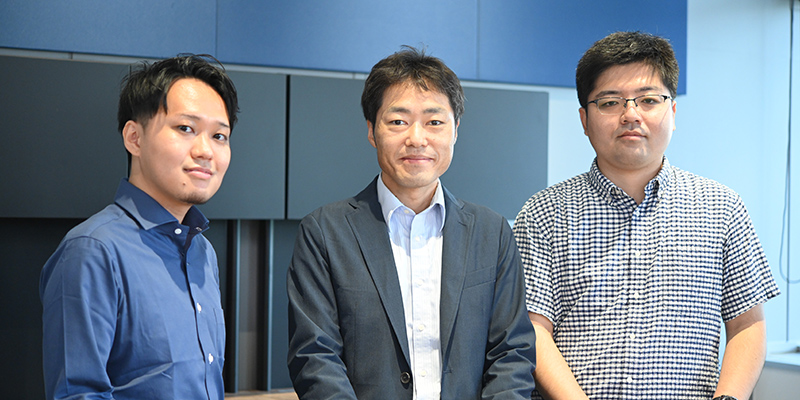
Principal Researcher
Takahiro Kumura
― What kind of technology is the bridge degradation detection technology using satellite SAR?
Kumura: It is a technology which uses satellite synthetic aperture radar to irradiate radio waves from an artificial satellite and can analyze millimeter-level displacements of bridges. Because we know that larger displacements mean that there is significant bridge deflection between the bridge piers, we can streamline the bridge inspection work. So far, NEC has developed ground surface displacement analysis technologies using satellite SAR and utilized them to detect ground subsidence at airports (Figure 1), etc., and now that technology has been applied to bridges.
Now, there are roughly 720,000 bridges in Japan, and by law they must be visually inspected every five years. The inspections are performed by experts, but the number of experts is far smaller than the number bridges. In addition, the experts have been growing older in recent years, and there is a critical personnel shortage. With a pressing need to streamline inspections, this technology has been developed with the hope that it may improve the situation. It detects bridge anomalies using satellite SAR, so that the detected anomalies will be carefully checked through visual inspection. We think that it could perform such a screening function and periodic monitoring of anomalies in degraded bridges.
An advantage of using satellite SAR is that you can observe the entire bridge from the air. In addition, unlike optical images there are no concerns about being obscured by clouds, and you can conduct observations at night without any problems.
At the same time, there is also the approach of attaching sensors to bridges to observe anomalies, but there are issues concerning the cost of sensor installation and maintenance, ensuring power and communications, as well as the service life of the sensors. With satellite SAR, there is no need to attach sensors to bridges. You periodically monitor for displacement from a satellite to detect anomalies.
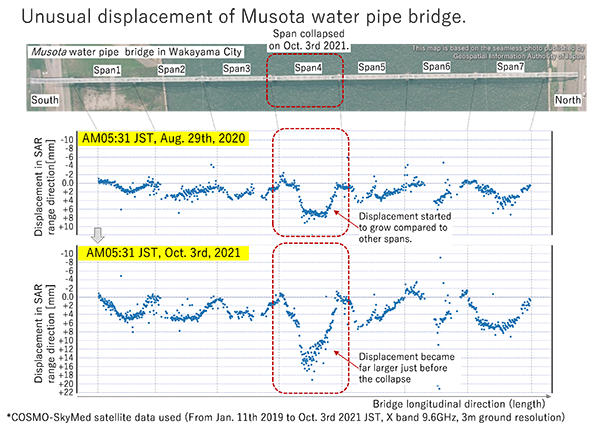
On this occasion, our team has obtained and analyzed the satellite data for the Musota water pipe bridge (Wakayama City), which collapsed in October 2021, and successfully detected the conceivable sign of the collapse (this analysis performed in the period from December 2021 to March 2022).
Visualizing the bridge displacements like a side-view to intuitively detect the displacements

Researcher
Yuki Yamaguchi
― What kind of mechanism do you use to detect the anomalies?
Yamaguchi: The radio waves irradiated from an artificial satellite are reflected back from the ground surface, and then we analyze the reflected waves. The information obtained from the reflected waves includes the "phase," which relates to the distance between the ground surface and the artificial satellite, in addition to the "amplitude," which is how strongly the waves were reflected. The points of analysis which focus on this phase are a major feature of our technology. The phase represents the position within the radio wave period. In the event that a phase shift occurs in the reflected waves during the first and second observations, it means that there was a change in the distance between the satellite and the ground surface, which may suggest a fluctuation such as uplift or subsidence, etc.
However, the reflections do not always return in a stable manner. There are cases in which the reflections are poor due to building materials, the reflections may be weak in locations with many trees, and noise can occur due to tree growth. How many stable reflection points can be selected is a key to successful analysis. Inevitably, reflections with a high amplitude are stable reflection points, so typically those points are selected for observation in usual cases.
However, in this technology development targeting bridges, the extremely low number of stable reflection points was a hopeless situation compared to other target cases such as ground surface and airport runways. Conventional method to get stable reflection points using amplitude information did not work in this case. So, we have developed a new method which utilizes phase information. Based on the assumption that if the reflection points are stable, their amplitudes and phases should show similar behavior over many observations, we tried to extract reflection points that match to this assumption. As a result, we have been able to extract an extremely large number of stable reflection points, which have made it possible to analyze bridge anomalies.
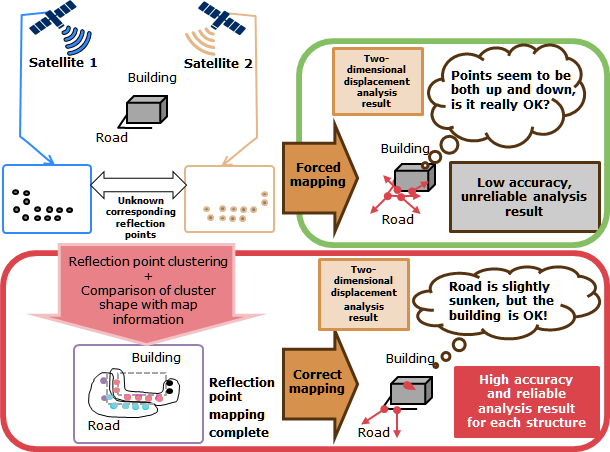
Kinoshita: An important problem in the analysis of the displacement data was mapping the analysis target with the reflection points. Even if you extract stable reflection points, in reality you cannot accurately identify which points those are on the surface. Images that Satellite SAR captures using radio waves has a different appearance from optical images. In addition, one pixel in the satellite data used this time corresponds to 3 meters square on the ground, and there was a limit to the minute mapping.
In response, our first thought was to focus only on the longitudinal direction of the bridge. The information in the width direction of the bridge was even discarded to look at only the two axes consisting of the longitudinal location and the phase. As a result, we have visualized the displacement in a state that was just like a side-view of the bridge, which allows people to look at it with their eyes and intuitively understand the displacement. Until now, the displacement obtained from satellite SAR was usually analyzed in a bird’s-eye-view point, but this breakthrough has been achieved through the approach to focus the axis of interest according to the analysis target.
The next problem was sparseness and density bias in the visualized reflection points. How to detect anomalies under a condition in which there were also outlier displacement values included became an issue. In response, we have resolved this issue by introducing a mathematical model to represent the displacement of each position in the longitudinal direction of the bridge. By modeling the displacement values at individual reflection points using a mathematical expression, it has become easy to understand the displacement of a bridge as a structure. This enables the discovery of "unusual" changes in the parameters of the mathematical model and "anomaly detection" which regards those changes as anomalies.
Moreover, based on knowledge such as the occurrence of displacement due to thermal expansion and contraction or similar displacements occurring in bridge sections with the same structural form, the mathematical model and its parameters are composed such that the relationship between displacement and temperature or the relationship between the structural form and displacement can be used. In the analysis results for the Musota water pipe bridge, among the seven spans having an arch structure, the center span which collapsed shows significant displacement compared to the others, which can be determined to be abnormal (Figure 2).
Considering the combination of systematization and anomaly causal analysis

Researcher
Kosuke Kinoshita
― Please tell us about the future prospects and goals for this technology.
Kumura: First, we plan on further increasing the analysis precision of this technology. We already submitted a paper on details of the displacement analysis shown in Figure 2 and will make a presentation on it at the Japan Society of Civil Engineers Third AI and Data Science Symposium in November 2022. Moreover, we would like to sophiscticate the analysis process and to automate it in a systematic way in order to make this technology even easier to utilize. In addition, we would also like to expand the targets to include not only bridges but also structures such as railroad bridges and runway approaching light brides, etc.
Kinoshita: As a subject of further development, I would like to address "estimation of cause." I am thinking of developing a technology that can estimate the cause of an anomaly when a displacement is detected and combining it with this technology. Of course, even if this technology is openly productized, it would be even easier for customers to use if it not only detected anomalies but also was able to estimate and indicate the cause. I think that in order to do so, you would also need a perspective which, for example, analyzes a bridge in terms of the structural dynamics, so I would like to carry out research from such an approach.
Yamaguchi: For that reason, I would like to make it possible to pick out a greater number of stable reflection points. If, for example, deviations occurred in the analysis results for a bridge being observed, it would be a significant problem. In past research, we started thinking that other factors may be involved when reflections do not properly return, so I would like to clarify whether that is the case. If this becomes possible, then the number of targets that can be analyzed will probably dramatically increase.
- ※The information posted on this page is the information at the time of publication.

The digitization of bridge inspection typically involves the approach of taking pictures and videos using a drone and scientific measurement using sensors. In contrast, this technology utilizes an artificial satellite to enable a broad range of analysis. Not necessary to think about the cost of installing sensors, securing a power supply, or the service life of the sensors is also a significant advantage. Moreover, this technology, which analyzes millimeter-level displacements using satellite SAR, was developed by NEC before anyone else in the world. In recent years, research projects which take a similar approach have appeared, but this technology, which visualizes bridge spans three-dimensionally using the longitudinal direction and displacement in this way to understand the displacement tendency, is a completely new method.
Related Link
- July 20, 2018 Featured Technologies
Two-dimensional Small Displacement Analysis Technology Utilizing Satellite Radars Enabling the Deterioration Inspection of Multiple Roads and Buildings in Urban Areas - July 20, 2018 Press Releases
NEC technology enables satellite radar to inspect urban infrastructure