
Message from the CFO

Fiscal 2015 Performance
The NEC Group recorded consolidated net sales of ¥2,935.5 billion for fiscal 2015, a decrease of ¥107.6 billion or 3.5% year on year. While the Public business saw an increase in sales, there was a decrease in the System Platform business. Also, sales of Others declined due to deconsolidation of the Internet service business and mobile phone sales business. Regarding profitability, consolidated operating income improved by ¥21.9 billion year on year, to ¥128.1 billion, mainly due to increased sales in the Public business and improved mobile phone business.
Consolidated net income was ¥57.3 billion, a year-on-year improvement of ¥23.6 billion. Despite a decrease in subsidiaries and affiliates' stock, there was improvement in operating income as well as in non-operating income including equity in earnings of affiliates and foreign exchange gain. In addition, there were minority interests in income from making NEC Fielding, Ltd. a wholly-owned subsidiary. As a result, return on equity (ROE) was 7.5%, a 2.7 percentage point improvement from the previous fiscal year.
Dividends and Returns to Shareholders
NEC intends to adopt a policy that best responds to the rapidly changing business environment. Thus, the Company considers, among other factors, the following in determining its cash dividends: the profits earned in the relevant fiscal year; the financial outlook for the following fiscal year, the dividend payout ratio, and the internal demand for funds such as capital expenditures. NEC attained the target for operating income and net income, and a dividend of ¥4 per share was issued as promised at the beginning of the period. For the fiscal year ending March 31, 2016, NEC plans for an annual dividend of ¥6 per share of common stock while no interim dividend will be paid.
| (Billion ¥) | FY2014/3 | FY2015/3 | |
|---|---|---|---|
| Results | Initial plan | Results | |
| Net sales | 3,043.1 | 3,000.0 | 2,935.5 |
| Overseas sales | 569.2 | 586.8 | |
| Overseas sales ratio | 18.7% | 20.0% | |
| Operating income | 106.2 | 120.0 | 128.1 |
| Operating income ratio | 3.5% | 4.0% | 4.4% |
| Net income | 33.7 | 35.0 | 57.3 |
| Return on equity (ROE) | 4.8% | 7.5% | |
Fiscal 2015 Financial State
Total assets were ¥2,620.7 billion as of March 31, 2015, an increase of ¥115.3 billion compared with the end of the previous fiscal year. Current assets as of March 31, 2015 increased by ¥73.9 billion compared with the end of the previous fiscal year to ¥1,576.8 billion, mainly due to an increase in accounts receivable-trade.
Noncurrent assets as of March 31, 2015 increased by ¥41.4 billion compared with the end of the previous fiscal year to ¥1,043.9 billion, mainly due to increased retirement benefit assets.
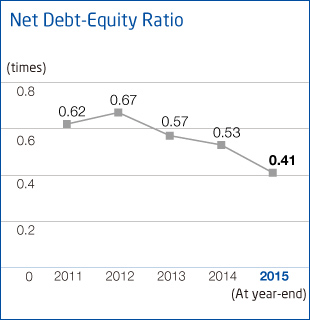
Total liabilities as of March 31, 2015 decreased by ¥1.2 billion compared with the end of the previous fiscal year, to ¥1,736.5 billion. The balance of interest-bearing debt amounted to ¥520.8 billion, a decrease of ¥54.4 billion compared with the end of the previous fiscal year. The debt-equity ratio as of March 31, 2015 was 0.63, an improvement of 0.20 points compared with the end of the previous fiscal year. The balance of net interest-bearing debt as of March 31, 2015, calculated by offsetting the balance of interest-bearing debt with the balance of cash and cash equivalents, amounted to ¥339.6 billion, a decrease of ¥28.9 billion compared with the end of the previous fiscal year. The net debt-equity ratio as of March 31, 2015 was 0.41, an improvement of 0.12 points compared with the end of the previous fiscal year.
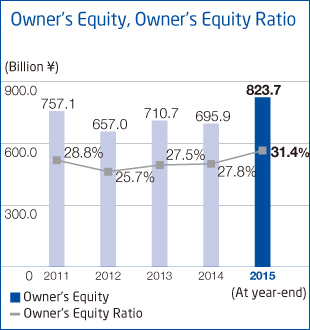
Total net assets were ¥884.2 billion as of March 31, 2015, an increase of ¥116.5 billion compared with the end of the previous fiscal year, mainly due to the recording of net income and an increase in the remeasurements of defined benefit plans for the fiscal year ended March 31, 2015.
As a result, the owner's equity as of March 31, 2015 was ¥823.7 billion and owner's equity ratio was 31.4%, an improvement of 3.6 points compared with the end of the previous fiscal year.
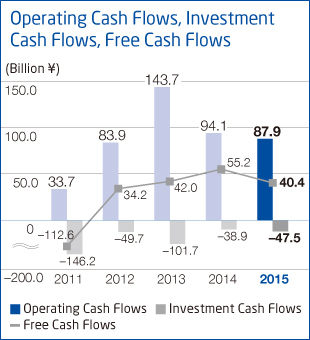
Net cash inflows from operating activities for the fiscal year ended March 31, 2015 were ¥87.9 billion, a worsening of ¥6.2 billion compared with the previous fiscal year, mainly due to worsened working capital.
Net cash outflows from investing activities for the fiscal year ended March 31, 2015 were ¥47.5 billion, an increase of ¥8.6 billion as compared with the previous fiscal year. This was mainly due to increased outflows for business acquisitions, while in the same period of the previous fiscal year, the acquisition of trust beneficiary rights set to land and buildings of the NEC Group's Tamagawa business facilities was offset by cash inflows from the gain on sales of subsidiaries and affiliates' stocks.
As a result, free cash flows, the sum of cash flows from operating activities and investing activities for the fiscal year ended March 31, 2015 totaled a cash inflow of ¥40.4 billion, a decrease of ¥14.8 billion year on year.
Initiatives for Fiscal 2016
NEC has achieved year-beginning targets for operating income and net income for the past three years consecutively, including the year under review, and is shaping a structure capably of recording stable profits in addition to focusing on “Solutions for Society.” The business plan for the year ending March 31, 2016, the final year of the “Mid-term Management Plan 2015,” is to accelerate in strategic investments necessary for NEC to enter its growth trajectory. This will enable well-balanced business portfolio centered on sales and earnings growth in target domains or overseas to grow, and achieve better profitability and improved cash flows.
The NEC Group is preparing for the voluntary adoption of International Financial Reporting Standards (IFRS) from the fiscal year ending March 31, 2017, to enhance the international comparability of its financial information in capital markets.
At NEC, we will continue with our initiatives in establishing a strong finance foundation. In doing so, we aim to achieve initial targets in the upcoming fiscal year, and to record results in accordance with a year for growth.