
Global Site
Displaying present location in the site.
Retrieval-based Time-Series Data Analysis Technology
Using deep learning to extract and compare statistics and other characteristics of time-series data, retrieval-based time-series data analysis technology can assess and pass judgment on a given set of conditions with high speed and high precision. Unlike conventional data analysis techniques, retrieval-based time-series data analysis is not premised on static mathematical models and does not require extensive computations, so it significantly minimizes the problems involved in fine-tuning the model. By applying this technology to system monitoring, for example, you can automate the assessment normally performed by human observers — i.e., whether the current system condition is the same as usual and doesn’t have any problems, or it is different from usual, or it resembles a particular past event. This paper examines the features of this technology and highlights a number of use cases, including operation monitoring.
1. Introduction
The world today is awash in data. Sensors installed in factories, automobiles, electronic devices, and communications and security systems collect massive amounts of data every second of every day. This data can range from straightforward numerical values to texts, voices, and video. Conventionally, analysis of time-series data — that is, data that changes over time — is performed by mathematical models that express the characteristics of the data with mathematical formulae. Machine learning is applied to the data collected from sensors to build mathematical models. Once constructed, these models can be used for forecasting, anomaly detection, classification, and other tasks.
The difficulty with using these mathematical models for time-series analysis lies in the complex data preprocessing and parameter adjustments required. As a result, an effective model not only takes a long time to build, it also takes a long time to verify and assess. NEC has addressed this issue by developing retrieval-based time-series data analysis technology that significantly cuts back on preprocessing and fine-tuning time. Instead of using a static mathematical model to inform its analysis, this technology evaluates system conditions with a high degree of precision by comparing features mechanically extracted from time-series data. This paper introduces the details and use cases of this technology.
2. Retrieval-based Time-Series Data Analysis Technology
2.1 Overview
Retrieval-based time-series data analysis technology is an AI-based technology that assesses system conditions by analyzing time-series data collected from sensors and making it searchable. Using data collected from sensors installed in public and private infrastructure such as industrial plants, roads, bridges, railways, and automobiles, this technology provides high-speed, high-precision assessment of system conditions, quickly determining whether a system is operating normally or abnormally and facilitating anomaly detection, diagnosis, and prediction.
Retrieval-based time-series analysis does not model the data obtained from a target. Instead, it assesses the target’s conditions by comparing data characteristics. Using AI, it is able to identify the feature points of sensor data which are normally deduced empirically by human observers.
Conventional methods that use mathematical models require the selection and processing of data that matches the models, fine-tuning of models, and switching of models to handle changes in system operation modes. Retrieval-based time-series data analysis technology eliminates a lot of these computation-intensive operations by simply extracting data characteristics from the raw data and comparing them. Consequently, deployment can be executed much faster and the system can be up and running at an earlier stage when only a small amount of data is available, improving its precision as operation progresses.
2.2 Features of retrieval-based time-series data analysis
This technology is distinguished by two main features.
First, it automatically generates feature extraction engines that extract the salient features of the data using machine learning (Fig. 1).
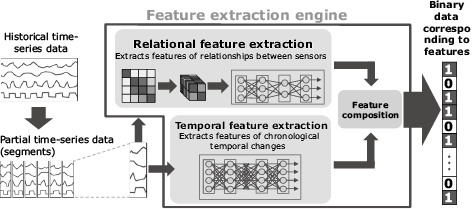
To extract features suitable for searching, this technology focuses on the following: (1) temporal changes in the data and (2) relationships between sensors. When the extraction is complete, these features are combined and then converted into binary data.
The second main feature of this technology is that it can generate a feature extraction engine as required using deep learning and NEC-original learning indices (Fig. 2). First, one of the accumulated data (segments) is selected as target data for random learning (9/9 in Fig. 2). Next, several segments of data are selected as verification data (9/1 to 9/5 in Fig. 2) and converted into feature values (binary data) using the feature extraction engine. If the most similar data to the 9/9 data (the learning target data), is the 9/5 data here, the feature value of 9/9 should really be closest to the feature value of 9/5. However, in this case the value of the 9/4 feature is closer. Based on this result, the parameters of the feature extraction engine are adjusted to raise the ranking to 9/5.
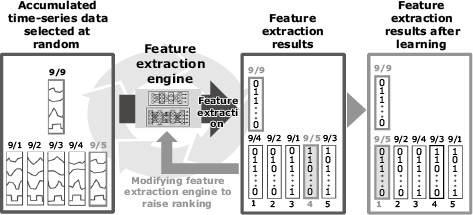
In conventional time-series analysis, similarities between feature values were used as learning indices. Unfortunately, improvements in similarities did not necessarily lead to improved rankings. This technology solves this problem by treating the rankings as learning indices, but since deep learning is not good at handling discrete values like rankings, the closest approximation is used.
Let’s assume the data you want to put in a higher ranking is yt (9/5 in Fig. 2) with respect to a certain learning target yq (9/9 in Fig. 2) and others are yj (9/1 to 9/4 in Fig. 2). At this time, the ranking of yt can be expressed as follows.
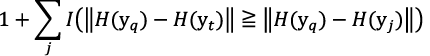
Here H(z) is a feature value of z and I (a ≥ b) is a function that becomes 1 when a ≥ b and 0 in other cases. In the above expression, the number of yj which has a more similar feature value to yq than yt is counted to find the ranking of yt. However, since yt is a discrete value, learning is facilitated by using the closest approximation.
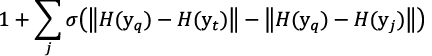
Here,
is a sigmoid function.
2.3 How this technology works
To show how retrieval-based time-series data analysis works, we use the example of system operation monitoring. Other use cases are discussed in Section 3.
Operation monitoring using retrieval-based time-series data analysis consists of three phases as shown in Fig.3.
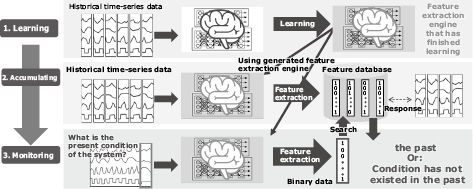
The first phase is the learning phase. In this phase, the feature extraction engine is generated. Time-series data collected from the various sensors installed in the target system is first apportioned into partial time series (segment) for each specific time period. Then each segment is repeatedly learned and relearned, ultimately creating a deep neural network that can convert the time-series data into binary data (the feature extraction engine in Fig. 3).
In the second phase, the generated feature extraction engine extracts the features of each time segment, converts them to a binary format, and stores them in the feature database. This makes it possible to compress the amount of data that needs to be searched, significantly boosting search speeds.
In the third and final phase, the feature database is applied to understanding target conditions and status. Current time-series data segments are converted into binary data and compared with historical binary data stored in the database. By referring to the historical data in the top search results, it is possible to determine whether the present condition is similar to a past event. If no similar past data is found, the present condition can be regarded as an unknown condition that has not occurred before; in other words, it is possible to determine that the present condition is highly likely to be abnormal. By comparing current events with previous events, target conditions can be assessed at high speed with high precision judgement, regardless of whether those conditions are normal or abnormal.
2.4 Performance evaluation
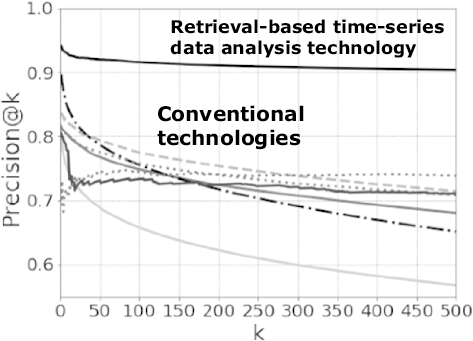
We verified the precision of this technology using the time-series data from 52 sensors, such as an accelerometer and heart rate monitor mounted on the human body, with tags for 13 action conditions, including standing and running1). We wanted to see how much similar data would be included in the search results when the past data was searched using time-series data representing a specific action as a search key. Specifically, we used Precision@k, which shows what percentage past conditions similar to present conditions appeared among the top search results that amount to k. The higher this value is, the more accurate the search.
The results of this test bore out our claim that this technology is faster and more accurate — accuracy was increased by at least 10% as shown in Fig. 4. The highest search accuracy of conventional technology is 90%, and accuracy decreases as the number of searches increases. With retrieval-based time-series data analysis technology, accuracy of 90% or more is maintained even when 500 searches are performed.
3. Use Cases
In this section, we discuss three use cases for our retrieval-based time-series data analysis technology. The first is an example of speeding up response to a failure during system operation monitoring. The second and third are examples other than operation monitoring.
3.1 Speeding up initial response based on the record of past responses
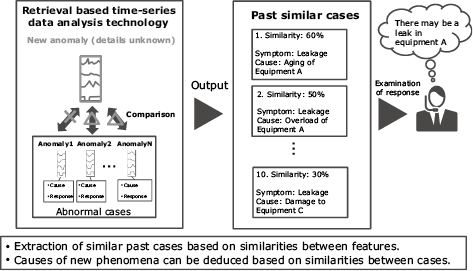
Because you never know when a failure will happen during system operation, it can be difficult to assess the problem and respond quickly. Our retrieval-based time-series data analysis can solve this problem. Not only does it compare current data with past data to determine what the problem is, it also reviews response records linked to past failures that had similar features as the current anomaly, providing details of those responses to enable an immediate response to the current problem.
Moreover, in addition to classifying the types of failures the current anomaly most closely resembles, our technology also shows the degree of similarity. This enables you to start investigating the current problem by referring to similar historical cases even if what is happening now is an unknown phenomenon that has never occurred before. Even if there is no past case that is a 100% match, this technology can still present the symptoms, causes, and occurrence locations of the most similar past cases, enabling maintenance personnel to better understand what they are dealing with and providing them with the data they need to investigate possible causes and remedies (Fig. 5). This speeds up response time when a failure occurs and decreases the amount of time that needs to be devoted to resolving the problem.
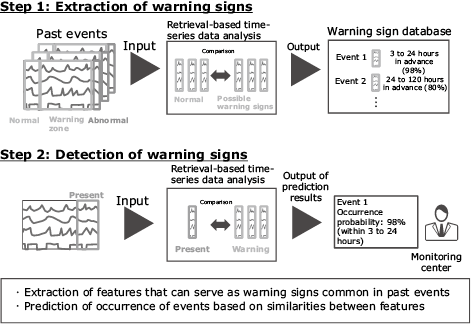
3.2 Predicting the likelihood of an event occurring by detecting warning signs
Collection and storage of time-series data and past cases enables extraction of common features from similar cases. This makes it easy to detect warning signs that commonly appear prior to equipment malfunctioning, allowing you to take preventive action before a failure occurs. This early warning capability can be applied in other situations as well, not just operation monitoring. For example, by analyzing sales data and social media trending data, you can predict undesirable events such as running out of stock at the same time as demand increases or over-stocking due to rapid decrease in demand (Fig. 6). By capturing the features of fluctuations in demand or changing trends, you can take proactive measures such as increasing or decreasing production as required. In the future, this function could even be used to predict the occurrence of unheralded events such as a surprise street performance by a popular musician by picking up changes in the number of keyword appearances on social media. This would allow police officers to be deployed in advance to ensure security.
3.3 Prediction based on past results
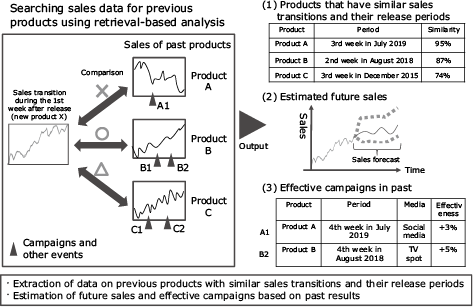
When a new product is released, little data is available and it is difficult to predict sales using regression analysis or other means. However, even in this case you can still use this technology to predict sales by searching past product releases for products that had similar sales transitions.
Specifically, you first compare the sales data immediately after the release of the new product with the sales data for various previously released products to find products that have similar features ((1), Fig. 7). This allows you to predict the sales trendline for the new product based on sales results patterns for similar products ((2), Fig. 7). You also use associated data on the effectiveness of marketing campaigns executed for similar products to obtain suggestions for advertising media and marketing details that may contribute to the increase of sales ((3), Fig. 7). In this way, you can more reliably predict future results based on past results, as well as deploy previously successful strategies to enhance your current campaign.
4. Conclusion
In this paper, we have demonstrated that NEC’s retrieval-based time-series data analysis technology can achieve high-speed, high-precision solutions by utilizing deep learning to extract and compare the features of time-series data. Fast, flexible, and accurate, retrieval-based analysis is ideal for monitoring of the operations of large-scale, complex systems. It is also equally applicable to various other kinds of time-series data such as sales transitions and health data. We expect it will be widely deployed in the development of new solutions and the enhancement of existing solutions.
In the future, we plan to add the capability to analyze multimodal data such as text, voice, and video. At NEC, our goal is to promote a safer and more secure society. To achieve this, we will continue our research and development of time-series data analysis technologies and take them to the next level.
Reference
- 1)Song, Dongjin, et. al: Deep r-th Root of Rank Supervised Joint Binary Embedding for Multivariate Time Series Retrieval, Proceedings of the 24th ACM SIGKDD, pp.2229- 2238, 2018
Authors’ Profiles
YOSHINAGA Naoki
Assistant Manager
Security Research Laboratories
Assistant Manager
Security Research Laboratories
TOGAWA Ryosuke
Assistant Manager
Security Research Laboratories
Assistant Manager
Security Research Laboratories
AJIRO Yasuhiro
Principal Creator
Security Research Laboratories
Principal Creator
Security Research Laboratories