
Global Site
Displaying present location in the site.
Effective Data-Based Approaches to Disease Prevention/Healthcare Domains
The low birthrate and the increase in population ageing in Japan continues to accelerate into the future and the national medical costs are expected to grow to 66.7 trillion yen by 2040. As the increase in medical expenses and the decrease in the working generations are becoming social issues, an awareness of disease prevention and healthcare management are becoming more and more important. This paper introduces the effective, scientific approach of NEC Corporation in challenging the issue of prevention/healthcare management. It is based on the analyses of previously collected data using AI, instead of blindly adopting random measures. The procedure described below attempts to identify the causal relationship between lifestyles and laboratory values by combining the traditional statistical techniques and AI (heterogeneous mixture learning).
1. Introduction
Japan has recently become a super-aged society with a rate of 27.7% of the domestic aging population (2017). This trend is expected to increase further and it is believed that 33.3%, or one third, of the Japanese population will be aged 65 or over in 2036. The national medical costs are also expected to increase from 39.2 trillion yen in FY2018 by about 170% and to reach 66.7 trillion yen by FY2040. In particular, the lifestyle-related diseases occupied a 30% share of the total medical expenses and a 60% share of the causes of mortality as of FY2004. This trend is still one of the biggest factors causing an increase in the medical costs. As such diseases are hard to cure completely, their prevention and healthcare management are regarded as being especially important.
Since FY2015 the Japanese Ministry of Health, Labor and Welfare have requested the establishment and enforcement of “Data Health Projects” to all of the health insurance societies. The ministry says that their goal is to take a scientific approach based on data usage, so as to improve the effectiveness of each project, thereby eventually leading to a reduction in medical expenses. This procedure would contrast favorably with the policy of blindly performing enforcement of any suggested healthcare project.
Below we introduce cases of data-based approaches for improving the effectiveness of healthcare projects by learning from trends in previously obtained medical checkup data by using an NEC-unique AI technology.
2. Preventive Approach Using Medical Checkup Data
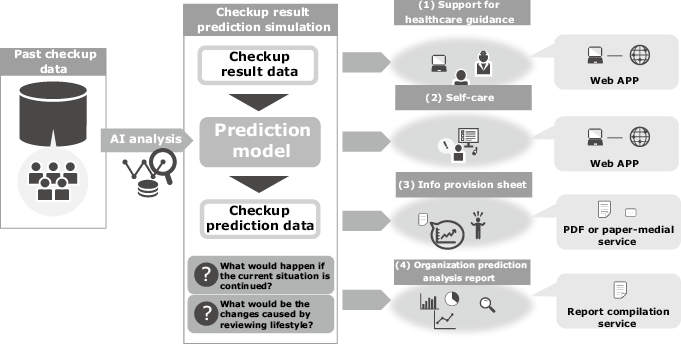
NEC Solution Innovators, Ltd. are challenging the prediction of future medical checkup results by analyzing the stored medical checkup data as big data as shown in Fig. 1.
2.1 Objectives of health prediction
Integrated analysis of lifestyles and laboratory values of the health check data make it possible to predict the outcome of a person’s future health condition by simulating his/her lifestyle if their present lifestyle is continued or if he/she changes and improves their lifestyle. The objective of this prediction is to promote changes in personal behavior and to make proposals that are expected to bring about greatly improved results.
2.2 Prediction technology
Prediction analysis employs NEC’s unique heterogeneous mixture learning technology, which automatically discovers highly accurate regularities from a large variety of data and outputs optimum predictions matching the situations based on these regularities. The analysis is also able to show the reasons for the predictions obtained.
2.3 White-box AI
Recently, the use of AI is focused on achieving “accountability”. In a case where an AI judgment result itself affects a life, there would be various concerns. If the reasons for the judgment are unclear these might include conviction and fairness issues. The principles of the fairness and ethics of AI use are being compiled in Japan and in Europe. The draft AI principle plan elaborated by the Japanese government in December 2018 mentions the “accountability of the decision process for the enterprises making use of AI”, as well as the safeguards provided by private information and security.
Private enterprises are required to achieve “fairness”, “accountability” and “transparency” in their use of AI. In the prediction of future medical checkup results with the aim of disease prevention, it is an important matter to assess the validity of predictions by confirming the aims.
3. Estimation of the Effects of Lifestyle Improvements on Laboratory Values
To achieve the objectives described in section 2.1, a prediction should be performed based on the knowledge of how much a change in lifestyle would affect the laboratory values (hereinafter referred to as the causal effects).
This section is intended to estimate the causal effects influencing exercise habit changes on body weight.
The verifications are performed using the medical checkup data of Kurashiki Central Hospital from FY2011 to FY2017 (total 297,409 checkups of 85,991 samples).
Whether or not each sample includes the exercise habit is determined according to the interview item prescribed in the Questionnaire on Specific Health Checkup “Are you in the habit of doing exercise in order to sweat lightly for over 30 minutes at a time, twice weekly, for over a year? (answer to be chosen from Yes and No)”.
3.1 Verification 1: Stratified comparison of body weight depending on the existence of an exercise habit
Firstly, the samples receiving checkups in FY2017 (N = 29,436) were divided into the group answering “Exercise habit: Yes” (Group A, N = 7,392) and the group answering “Exercise habit: No” (Group B, N = 22,044). The average body weights of the two groups were then compared. The average body weight of Group A was 61.87 kg and that of Group B was 61.05 kg. Is it right then to estimate that, when the exercise habit is changed from No to Yes, the causal effect on the body weight effect is 0.82 kg, this being the difference between the average body weights of the two groups? The answer is no, this estimation is inappropriate because of the following two main problems.
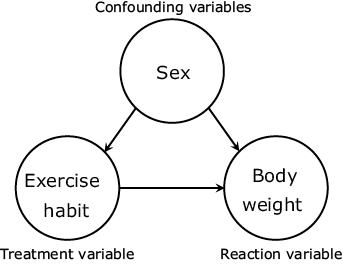
The first issue is the non-consideration of the influences of variables that have causal relationships with both the exercise habit and body weight (confounding variables). For example, with the “sex” variable, when men have a larger average body weight than women and tend to perform the exercise habit more frequently, the difference in the average body weight values may possibly include the effects of the difference in male/female ratios of the two groups, in addition to those of the exercise habit (Fig. 2). In fact, the male ratio of Group 1 was 0.590 while that of Group B was 0.449, suggesting that the sex is a confounding variable in this data.
The second problem is that the comparison target values do not indicate the causal effects related to changes “inside” the samples. As described above, the verification divides the samples into two groups according to the differences in their exercise habit over a fiscal year. As a result, the difference between the average body weights of the two groups is merely “the difference in the average body weight of groups with and without the exercise habit”. This does not mean “the change in the body weight of a sample after acquiring the exercise habit that did not previously have the exercise habit”. This is not the data that the verification intended to collect.
3.2 Verification 2: Comparison considering confounding variables and individual changes
Next is the verification for solving the problems described in section 3.1. This is specifically performed with the following procedure.
- (1)The verification uses the checkup data of two consecutive years instead of the data of a single year. Assuming that the propensity of causal effects does not differ between years, all of the data of two consecutive years selected arbitrarily are extracted from the total datasets of N1 x 7 years. The obtained data set becomes the N2 x 2 years (t=1, 2) dataset.
- (2)From the dataset obtained in (1), only the “Exercise habit: No” samples of t=1 are extracted.
- (3)The group of samples extracted in (2) are divided into the group that continued to exercise in t=2 (the case study group) and the group that did not (the control group). However, in this two-group division, it would not be possible to obtain optimum estimates if the samples are divided based only on whether the data in t=2 is “Exercise habit = Yes”. This is because it is unknown at which points in the two years the exercise habit was performed and for how long it was continued. This issue is dealt with by adopting the answers to the questionnaire item “Do you want to improve your lifestyle of eating and exercising?” (The answer to be chosen from five options including: ‘Don’t want’, ‘Do want (within 6 months)’, ‘Do want (in near future)’. ‘Already trying (less than 6 months)’ and ‘Already trying (over 6 months)’). Hereinafter this question will be called the lifestyles improvement situation. Specifically, only those samples that answered “Exercise habit: Yes” and Already trying (over 6 months)” in t=2 are grouped in the case study group and the other samples are grouped as the control group.
- (4)For the two groups divided in (3), the confounding variables between them are adjusted using propensity score matching1). The estimation is specifically performed based on the confounding variables of the probability that the treatment variable “Exercise habit” becomes “Yes” in t=2 (propensity score) and in the reaction variable (body weight). The confounding variables used here are “Age”, “Sex” and “Life habits” in t=1 (based on the standard questionnaire) and the “Lifestyles improvement situation”. The estimation model used is the logistic regression model. After the division, matchings of the samples having close estimated propensity scores in the two groups, are performed to generate the final two groups. The matching method is the differential nearest-neighbor matching and the level is the recommended value2) of 0.2.
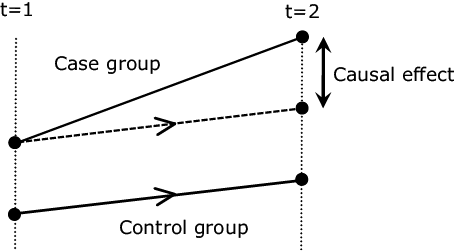
- (5)For the two groups subjected to the matching in (4), the causal effect of the change in exercise habit on the body weight is estimated using the differences in the differences technique3). Specifically, the average body weight change of the control group in t=1 -> 2 is subtracted from the average body weight change of the case study group and the obtained difference is defined as the average causal effect (Fig. 3).
The first problem (absence of consideration of confounding variables) can be solved by adjusting the confounding variables by the propensity score matching in (4) (however, unobserved confounding variables are still not considered).
The second problem (estimation of causal effects “inside” samples) can be solved by considerations between the two time points in (1). These are the appropriate extraction of the two groups in (2) to (4) and the considerations of both the difference between the two groups and that between the two time points using the difference in the differences technique in (5). N.B. However, this solution assumes that the change if the case group is not treated (counterfactual thinking, represented by dashed line in Fig. 3) is equivalent to the change of the control group.
As a result of the verification based on the above procedure, the number of the dataset obtained by (1) had N=145,814, which became N=108,688 after the sample extraction in (2). These samples were further divided into the case group (N=3,047) and control group (N=105,641) in (3). After the propensity score matching in (4), the control group was reduced to N=3,047, which means that it has become a sample set with a propensity score distribution close to the case study group. For the propensity score estimation, the c-statistic (AUC) was 0.826 when the ROC curve representing the identification performance of the two groups. This value is larger than the desired value of 0.8.
The body weight change estimated by practicing and continuing the exercise habit indicated by the difference of differences technique in (5) was -0.804 (Pr(>|t|) = 0.0649. This can be interpreted as indicating that an average body weight reduction of about 0.804 kg can be expected when a sample without the exercise habit continues this habit for over 6 months.
4. Examples of future checkup data prediction models
This section introduces the prediction models of one year after among the prediction models built by means of heterogeneous mixture learning using the data at the Kurashiki Central Hospital.
The variable sets used in the models are determined based on the results of verifications in section 3 and by considering the confounding variables, etc. Among the set, the variables used in each model are selected automatically by heterogeneous mixture learning.
4.1 Piecewise sparse linear model
On this occasion, we have constructed a piecewise sparse linear model with an especially high interpretability, which is one of the features of the heterogeneous mixture learning. This model has a binary tree structure such as that the internal nodes have the conditional equations and the external nodes (leaf nodes) have the linear regression models. Which regression model is to be used in the prediction is decided per each sample by tracing the conditional equation from the root node to the leaf node.
4.2 One-year later body weight prediction model
The body weight prediction model built on this occasion has a structure that can be divided into three linear regression models according to the conditional equations. Each linear regression model has the coefficient to the body weight value of one time point before the prediction target value. Since these are the models for predicting cases in which the future lifestyles are fixed, the lifestyles at the moment of prediction are also contained in the regression models. This procedure is equivalent to the structural vector auto-regression (SVAR) model.
This model uses a specific linear regression model with the samples that weighed more than 86.5 kg in the last checkup. The liner regression model indicates the result that the sample person who did not have the habit of “eating snacks after supper” at the time of the last checkup increased weight by 1.04 kg on average by comparing two scenarios. These were (1) when the person adapts the habit and begins “eating snacks after supper” and (2) when the person maintains the current habit. It also indicates the result in decreasing the weight by 0.89 kg in average of the person that did not have the habit of “walking quickly” at the time of the last checkup by comparing two scenarios; when the person improves the habit and continues “walking quickly” and when the person maintains the current habit. It is due to the heterogeneous mixture learning that makes it possible to learn such a highly interpretable model automatically.
5. Conclusion
AI is expected to be utilized in various domains. Considering the estimation that the amount of human health-related information is likely to increase at an explosive pace, its applications are expected to perform highly in the disease prevention and healthcare domains.
NEC has determined to advance R&D in these domains by implementing the combined analysis of a wide variety of data based on the technology developed via medical checkup data analysis. At the same time, we aim to expand the analysis range and to provide information with further diversify.
References
- 1)Paul R. Rosenbaum and Donald B. Rubin: The Central Role of the Propensity Score in Observational Studies for Causal Effects, Biometrika, Vol. 70, No. 1, pp.41-55, April 1983
- 2)Paul R. Rosenbaum and Donald B. Rubin: Constructing a Control Group Using Multivariate Matched Sampling Methods That Incorporate the Propensity Score, The American Statistician, Vol. 39, No. 1, pp.33-38, February 1985
- 3)A. Abadie: Semiparametric difference-indifferences estimators, The review of Economic Studies, Vol.72, No.1, pp.1-19, January 2005
Authors’ Profiles
TANAKA Hirofumi
Professional
Innovation Strategy Division
NEC Solution Innovators
Professional
Innovation Strategy Division
NEC Solution Innovators
TAJIRI Toshikazu
Innovation Strategy Division
NEC Solution Innovators
Innovation Strategy Division
NEC Solution Innovators