
Global Site
Displaying present location in the site.
Case Studies of Data Utilization by Municipal Governments: Applying Data in Various Fields Such as Financial Affairs, Childcare, and Community Revitalization
Demonstration and Implementation Examples of Data-driven Smart CitiesThroughout Japan, municipal governments are required to implement the Comprehensive Strategy for Revitalizing Towns, People and Work. To ensure efficient and carefully planned management of policies and projects in areas such as financial affairs, childcare, and community revitalization, a new methodology for policy-making that derives insights from data collected from various sources needs to be examined and established. In this paper, we describe the actions undertaken by Okazaki City and Mito City in pursuit of this goal.
1. Introduction
In recent years, the evolution of big data and the expansion of IoT (Internet of Things) technologies have encouraged more and more municipalities in Japan to seek ways to exploit the large amounts of data collected from various sources together with the analytical power of AI to plan new strategies in line with the national government's Act on Overcoming Population Decline and Vitalizing Local Economies in Japan, which was decreed on November 28, 2014. Using the Comprehensive Strategy for Revitalizing Towns, People and Work as a blueprint, Okazaki City in Aichi Prefecture and Mito City in Ibaraki Prefecture, working in close collaboration with NEC, launched a number of initiatives aimed at actualizing the principles of the Comprehensive Strategy.
2. Okazaki City Case Study: Using Data Analysis to Support Administrative Planning
2.1 Background of data analysis initiative
Committed to adhering as closely as possible to the strategy formulated in the Comprehensive Strategy for Revitalizing Towns, People and Work, Okazaki City wanted to find a way to better exploit the huge amounts of data it had already collected. Over the years, NEC has developed an extensive portfolio of data-driven projects, accumulating the experience and expertise in big data and AI analytics to provide the support the City needed to successfully realize its goals.
2.2 Issue 1: Population maintenance and increase - analysis of open data obtained from core cities
Limiting or reversing population decline is one of the nation's greatest challenges. At the local level, it can affect not only the sustainability of a municipality, but its very existence. To address this issue, we decided that, in addition to using data obtained from Okazaki City, we would also use open data from core cities throughout Japan.
The first step was to perform a correlation analysis. What we mean here by correlation analysis is an analysis method used to determine if there is a correlation (linear relationship) between variables. By calculating correlation coefficients, you can objectively indicate relationship between variables with numerical values. Data items that correlate highly with the total fertility rate (TFR) are listed in descending order in Fig. 1.
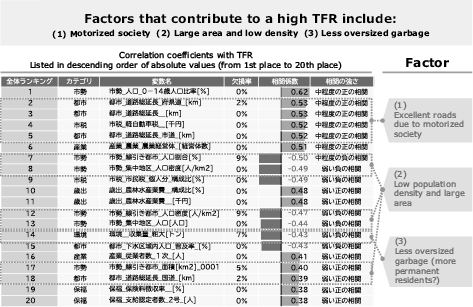
As shown in this table, the factors that are highly correlated with a high TFR are: (1) motorized society, (2) large area and low population density, and (3) less oversized garbage. While these correlations do not demonstrate a cause-and-effect relationship, it makes sense to prioritize policies that support these factors.
2.3 Issue 2: Fiscal forecast
Every year, municipal governments typically formulate their budgets based on estimates of the revenues and expenditures for the next fiscal year. Administrative planning is based on the budget. As revenues and expenditures are difficult to predict, the budget is not set in stone and a reserve fund must always be secured. Securing a reserve fund may sometimes make it necessary to put off some projects. We verified whether a fiscal forecast that applied various algorithms to past expenditure data would make it possible to formulate a reliable budget that would have higher precision than a conventional budget dependent on the experience and intuition of municipal staffers.
Fig. 2 shows the results of the verification where we used the financial system data for the past six years as learning material and tried to see how close we could get to the actual past results.
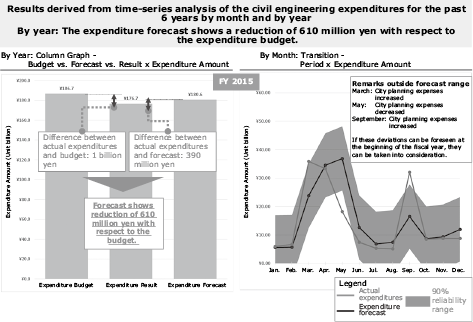
(by Month/Year) - Civil Engineering Expenditures.
These graphs compare the differences between the forecast values and the actual results in fiscal 2015. The column graph on the left shows yearly comparisons of the budget, results, and forecasted civil-engineering expenses while the line graph on the right shows the transition in expenditures by month. In the graph on the left, the left column represents the budget, the center the result, and the right the forecast. In the graph on the right, the actual results and forecast values are represented with lines, while the range with 90% reliability is shaded.
As is clear from these graphs, the difference between the actual civil-engineering expenditures and the budget is 1 billion yen, while the difference between the actual expenditures and the forecast is 390 million yen. Had the forecast been adopted, a budget reduction of 610 million yen would have been possible. Moreover, the monthly forecast is highly precise and seasonal fluctuations can also be forecast.
For the time-series analysis, we analyzed each expenditure item. The aggregated results of this analysis are shown in the column graph in Fig. 3. The stacked column on the left represents the results when budget is subtracted from the result - which is the actual condition. The stacked column on the right is the representation when the result is subtracted from the forecast. When you compare it with the actual condition, you can know that there is a 1.07 billion yen difference. This clarifies that it is still possible to improve the accuracy through analysis.
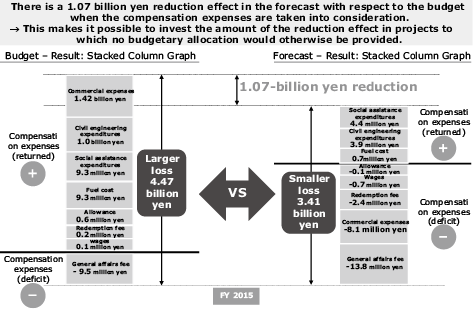
It should also be noted that, although the reduction effect is obvious, there are far more items that fall in the category of compensation expenses (deficit) in the "Forecast ? Result" column. This is the issue we need to address in the future.
2.4 Issue 3: Resident satisfaction survey
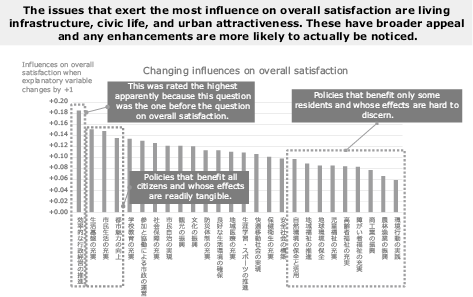
To turn the resident satisfaction survey results into quantitative data, we conducted a regression analysis in which we analyzed the relationships between the projects. Fig. 4 shows the results of this analysis. We performed regression analysis by asking the citizens to check the most appropriate answer to each question as follows:
-
Very dissatisfied
-
Slightly dissatisfied
-
Neither satisfied nor dissatisfied
-
Slightly satisfied
-
Very satisfied
These answers were then turned into numerical value data and subjected to regression analysis. In Fig. 4 below, the issues that can affect overall satisfaction - which was rated independently of other entries - are listed from left to right in the order of higher to lower scores. This graph makes it clear that projects such as living infrastructure, civic life, and urban attractiveness can exert more influence on overall satisfaction than other projects.
We also performed text mining using AI in the free comment field of the questionnaire1). Text mining is a process of deriving high-quality information from text by breaking down the aggregated text by word and analyzing its structure.
We applied text mining to the entries in the free comment field to find out what residents wanted. The results were broken down by sex and generation. Fig. 5 shows the relationships between words, as well as between sexes and generations after breaking down the text by word. In this chart, we get a bird's-eye view of those relationships. For example, we can see that demand for public facilities in general is high among females in their 20s to 30s, while demand more specifically for parks and hospitals is high among females in their 20s. As the age of the respondents increases, the relationship with the word "bus" becomes closer, suggesting that elderly people may be more likely to use buses than cars.
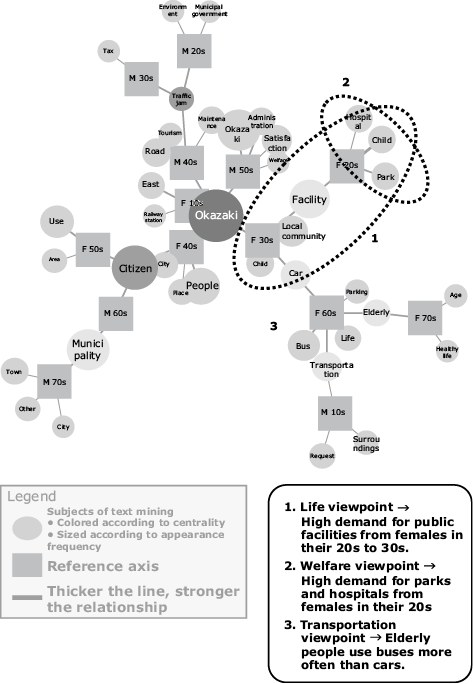
As we can see from the chart above, using AI to analyze the survey results enabled us to better comprehend how and what the citizens were thinking.
3. Mito City Case Study: Using Data Analysis for Fiscal Expenditure Optimization, Accounting Efficiency Improvement, and Internal Control
3.1 Analysis of fiscal expenditure forecast
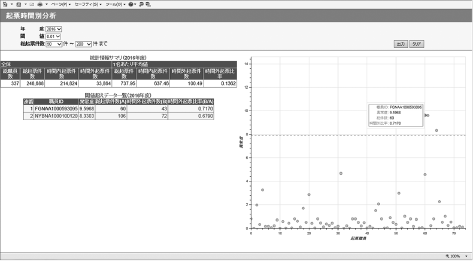
As we did in Okazaki City, we used big data analytics to forecast social assistance expenditures to support budget formulation for the municipal government of Mito City. We used Python Statsmodels, which is the world's leading open source statistical modeling software, to create a time-series analysis model. When we predicted the social assistance expenditure in FY 2016 based on the 3-year expenditure results from FY 2013 to FY 2015 using this model, we discovered that the model's forecast values were closer to the actual values (within about 100 million yen) than the requested budgetary amount. Hence, we confirmed that a time-series analysis model would be an effective tool for improving the accuracy of budget formulation.
In the future, we plan to conduct further verification of time-series analysis models in budgetary formulation and financial planning at relevant departments of the city by breaking down the forecast units by department, project, and month.
3.2 Improving accounting efficiency - automatic entry of withholding tax classifications
We also tested out the possibility of using AI technology to automatically determine what to enter in financial documents - especially for entries that are difficult to resolve. We used our machine-learning software called NEC Advanced Analytics-Text Analysis to create a model that would predict withholding tax classifications and expenditure items (sections) in accordance with the subjects of financial documents. And we were able to achieve very high F1 scores* of 98% for the prediction of withholding tax classifications and 97% for the prediction of expenditure items (sections). If such automatic entry support functionality and screening support functionality are packaged in a financial accounting system and offered to customers, it would be possible for them to dramatically reduce the time required for these tasks. For instance, let's assume that a 15-minute reduction in per case processing time to produce a financial document (including improvement in the return rate) is achieved. If this improvement is applied to an organization that produces 150,000 documents a year, a reduction of 37,500 man-hours can be achieved, leading to significant cost-savings on the order of a few hundred million yen per year.
We plan to continue this study and hope that we will be able to contribute to work-style reform in municipal governments, thereby reducing municipal expenditures.
3.3 Internal control - anomaly detection
The Local Autonomy Law was revised in June 2017. Taking effect as of April 2020, the revised law will require major municipalities (recommends smaller municipalities) to enhance their internal controls and to reform their audit systems. In collaboration with Mito City, we began researching and developing a system to support internal control and audit operations. Currently, internal municipal audits usually involve sampling of paper evidence. In the future, preventive audits - which are closer in concept to internal controls - are expected to be required, rather than conventional audits which only find problems after they have occurred. For this project, we developed AI functionality that predicts failures to create payment documents or settle accounts and warns of them. The effectiveness of this technology is now being evaluated. We are also working to develop anomaly detection functionality for financial and accounting data to monitor and deter accounting and financial fraud (Fig. 6).
- * Indices for evaluation of search performance. Also called F-measure. The balanced F1 score is the harmonic mean of precision and recall.
4. Conclusion
As cities throughout Japan explore the radical potential of big data and AI for creating smarter, more efficient urban environments that take advantage of highly networked services, NEC has played an active role in supporting municipalities as they progress towards this end by providing appropriate technologies, helping identify issues, and generating data-based solutions. In collaboration with Okazaki City and Mito City, we have tested and verified feasible solutions that use data analysis and AI to streamline budgetary procedures and reduce expenditures.
Reference

Authors' Profiles
AKASHI Ko
Manager
Community Solutions Division
Manager
Community Solutions Division
WATANABE Mutsumi
Manager
1st Community Solutions Division
NEC Solution Innovators
Manager
1st Community Solutions Division
NEC Solution Innovators