
Global Site
Displaying present location in the site.
Quality Control in Manufacturing Plants Using a Factor Analysis Engine
A factor analysis engine is an analysis technology that secures the product quality of manufacturing industry production plants. Traditionally, when the quality of a product deteriorates an expert analyzer is employed to assess the quality deterioration factors by using experience based data analysis. However, this process often takes a long time or is unable to accurately specify the factors. The factor analysis engine solves these issues by automatically analyzing the time-series data of the sensors installed in the production facilities, by identifying the factors that are causing the quality deterioration and by providing information on remedial action that leads to solutions. This paper introduces the characteristics and mechanisms of the factor analysis engine and also describes an example of its application.
1.Introduction
Industry 4.0 requires maximization of quality as well as cost reduction. In this paper we introduce the “factor analysis engine”, which is an analysis technology for securing quality in the industrial operations (production management) of manufacturing industry plants.
2.Present Issues
Manufacturing plants deploy various activities for improving quality. Nevertheless, quality deterioration such as in the occurrence of defective products still occurs due to various factors, which include equipment failures and other technical faults. If a factor causing the quality deterioration can be identified immediately, quality may then be restored by eliminating that factor. However, when identification is not possible, quality cannot be restored, thereby exerting important effects on the productivity.
Recently, it has been the function of an analyzer possessing expert knowledge on manufacturing plants and analysis technologies that was employed to analyze these factors. Nevertheless, such analyzes relying on personal capabilities takes time to deliver a satisfactory result or sometimes it is incapable of obtaining such a result. In addition, as production facilities are becoming increasingly complicated and each piece of equipment becomes a component part, the entire system has become a black box, with which identification of the quality deterioration factors is very hard to establish. This situation is further aggravated by the current shortage of suitably experienced analysis personnel.
At NEC, we are conducting R&D into invariant analysis as an analysis technology for detecting signs of equipment failures in such a complex system1). System Invariant Analysis Technology2) detects signs of failure from breaks in relationships between the time-series data acquired from the production facilities. It can discover anomalies caused by equipment failures but cannot discover anomalies in the values of sensors that do not have (linear) relationships with other sensors. The technology cannot detect an anomaly until a relationship is broken and it cannot analyze the cause even when a certain sign of anomaly exists before the relationship breaks. In order to deal with this issue, we are conducting R&D into the factor analysis engine as a supplementary technology to support invariant analysis.
3.Factor Analysis Engine
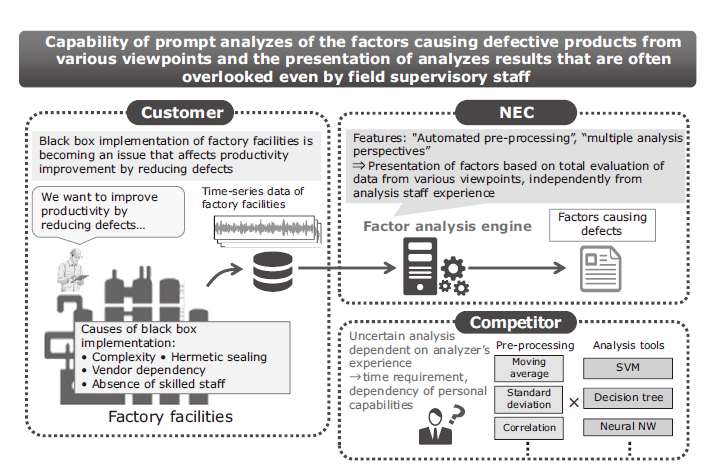
The factor analysis engine identifies the factors causing production of defective products in a manufacturing plant from the time-series data of the production facilities. Its features are shown in Fig. 1.
 Enlarge
Up to the present time, the technology has succeeded in automating the pre-processing function required for the analysis, identifying the causes from multiple viewpoints based on the pre-processing results and providing suggestions for improvement. This has been achieved without relying on the experience of the analyzers who used to evaluate production facility data in the factories. Specifically, the engine can extract and present the behavior (characteristics) of sensors that vary depending on quality so that the plant operators can adopt remedial procedures based on the presented results.
3.1 Input Data
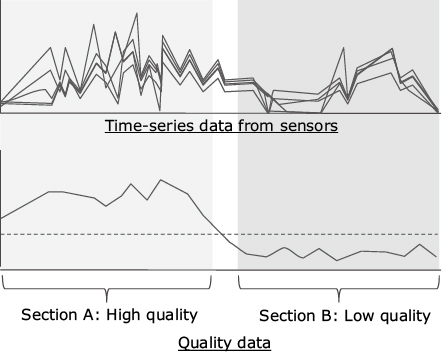
The input data required for cause identification consists of the time-series data from sensors installed at the production facilities (pressure, temperature, flow rate, etc.) and the quality data that enables judgments regarding high and low product quality. Fig. 2 shows an example of the input data. The upper graph depicts the time-series data of sensors and the lower graph the quality data. The curve in the lower graph represents the data obtained by measuring quality as a numeric value and the broken line represents the quality deterioration criterion. In this example, the quality is judged to be high when the value is above the judgment criterion and low when it is below the judgment criterion. Since it is sufficient for the input data to tell whether the current data belongs to the high-quality or the low-quality section, the analysis is possible even without the time-series data graph as shown in Fig. 2. This is provided that the information distinguishing section A for the high-quality section or section B for the low-quality section is available.
3.2 Factor Identification Technique
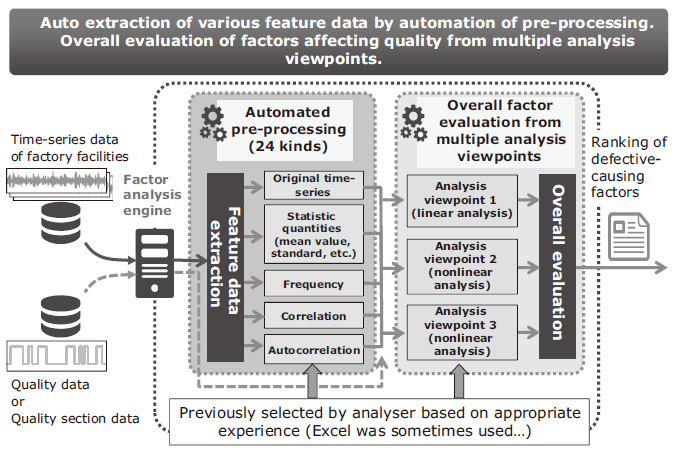
In this section, we will describe the factor identification techniques of the factor analysis engine by using Fig. 3.
 Enlarge
The factor analysis engine begins operation with the pre-processing of time-series data and the feature quantity extraction from the time-series data. Table 1 shows examples of the feature quantities.
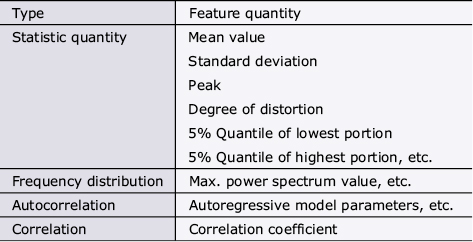
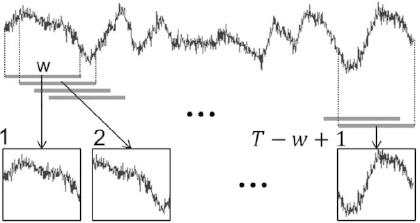
Regarding the feature quantities, sub-series data is generated by extracting a window with a certain period of time, w, from the time series data (1 to T – w + 1) and sliding the window (Fig. 4). Computations such as statistical processing are then applied to each of the sub-series to generate new time-series data on feature quantities (w is the window width and T the total length of the time-series).
Next, the time-series data on feature quantities obtained by pre-processing is used to generate the ranking of the feature quantities affecting the quality. For this purpose, the degree of influence of each feature quantity is scored for each of multiple feature selection techniques* (rankers) and the overall scores are calculated by normalizing the score of each ranker and merging the normalized scores.
3.3 Output Results and Interpretation
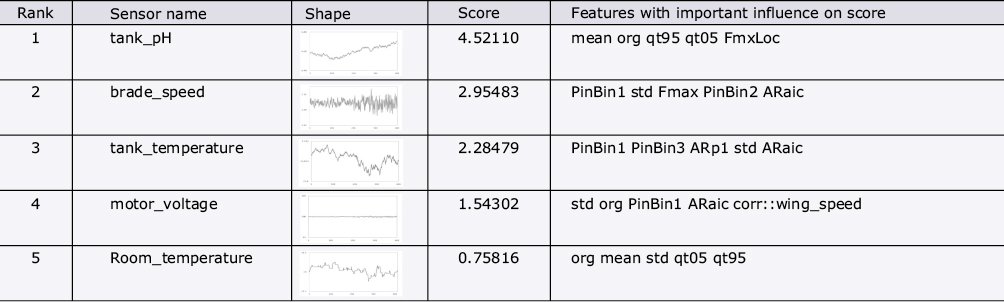
Table 2 shows an example of the final results output by the factor analysis engine. It presents the sensors affecting the quality by sorting them in order of score. The listed features include the sensor name, shape of time-series data, the score and time-series data citing important influences on the score (quality).
The sensor ranked as the top one in Table 2 has the name of tank_pH (pH value in tank), and the featured quantities exerting particularly important influence on it are the mean (mean value), org (original time series), qt95 (quantile of highest 5%), qt05 (quantile of lowest 5%), etc. These results allow the analyzer to understand that what is required is to apply controls so that the pH value inside the tank can maintain a status tending toward acidity.
 Enlarge
When we examine the rest of the rankings, we find that wing_speed (mixing blade revolution speed) is ranked in the second position. As PinBin1 (minimum frequency band among the power spectrum density of each frequency), PinBin2 (second minimum frequency band) and Fmax (maximum power spectrum density of resonance frequency) vary, we find that there is a certain issue with the way the blade revolves.
Based on the information obtained here, the fundamental cause of the problem can be disclosed and the quality can be improved by investigating and verifying the associated phenomena. For example, if there is an issue in the control of the mixing blades? if the machine is working as designed? or if there is any influence of the viscosity of the material?
4.Examples of Applications
4.1 Yield Deterioration Factor Analysis
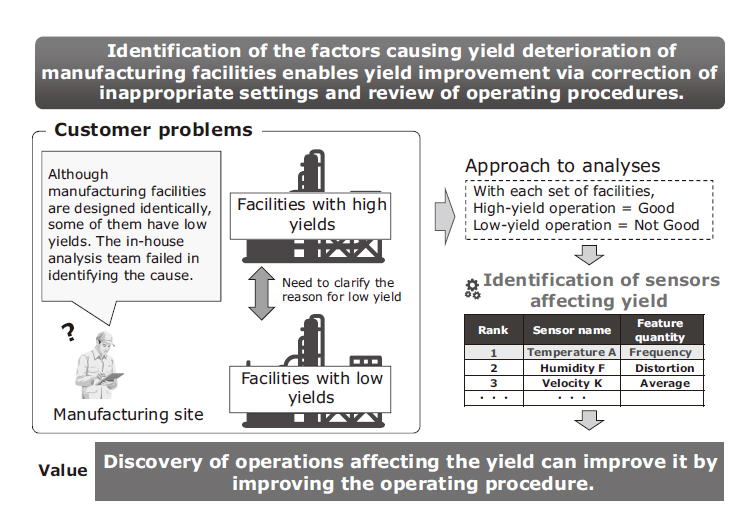
A typical application example of the factor analysis engine is when the yield of a product deteriorates. Products may be produced on multiple completely identical manufacturing lines using the same raw materials and the same control method and the yield may be deteriorated only for some of the facilities/lines (such as by a decrease in the density of the produced object). In this case the factor analysis engine can be applied to identify the factors causing the trouble. Improved yield can be expected by connecting the sensor and feature identification results in order to review the operating procedure and control the relevant parameters (Fig. 5).
 Enlarge
4.2 Facility Availability Rate Deterioration Factor Analysis
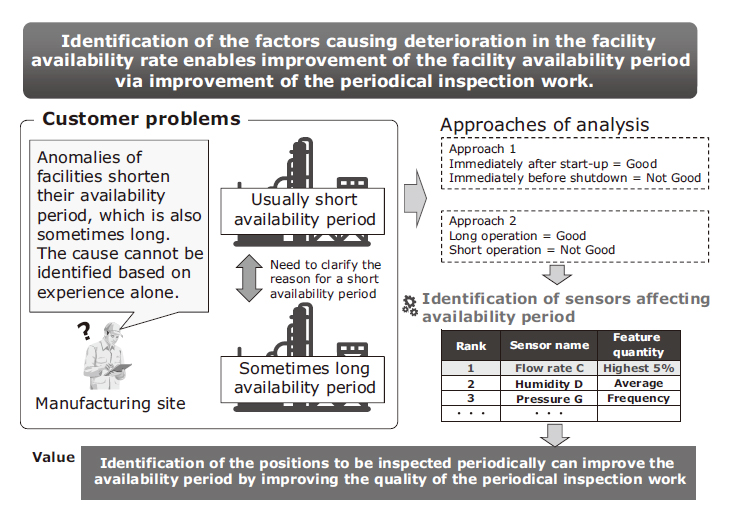
For example, in a chemical plant, periodical occurrences of piping blockages, etc. may cause production facility shutdowns and the availability rate is deteriorated as a result. If the period until the shutdown is diversified, it becomes difficult to establish the manufacturing and periodical servicing plans, which can lead to an increase in the costs. The factor analysis engine is capable of identifying the sensors that are affective over the period until shutdown (sensors that extend the period until shutdown and their features) as well as the operation parameters to be changed and the positions to be inspected and cleaned etc. These measures can extend the general period before shutdown and thereby prevent deterioration of the facility availability rate (Fig. 6).
 Enlarge
5.Conclusion
As described in the above, the factor analysis engine can identify the sensors affecting the deterioration of quality and their features from the time-series data and quality data. These can be called the quality deterioration factors. In addition to the quality deterioration, the engine can also identify the factors causing two kinds of status in various production facilities as seen with the yield deterioration factor analysis described in section 4. In the future, we intend to continue to improve the development of specific solutions by applying the factor analysis engine. This strategy is aimed at contributing to manufacturing plant quality improvement.
Reference
1) KATO K. et al.: “Big Data Analytics in the Cloud - System Invariant Analysis Technology Pierces the Anomaly –” NEC Technical Journal, Vol. 9, No. 2, pp.85-89, June 2015.
2) Haifeng Chen et al.: A Quality Control Engine for Complex Physical Systems, 2015 45th Annual IEEE/IFIP International Conference on Dependable Systems and Networks, pp.529-536, 2015.6
Authors’ Profiles
ASAKURA Takayoshi
Senior Manager
Security Research Laboratories
OCHIAI Katsuhiro
Principal Researcher
Security Research Laboratories