Global Site
Breadcrumb navigation
Why satellite observation data that visualizes marine environment is vital to scallop farming
Interview
Scallop farming in Mutsu Bay, an inner bay of Aomori prefecture of northern Japan, accounts for over 20 percent of the entire prefecture’s fisheries production by value. But in 2010, this scallop-rich seas experienced abnormally high temperatures, making it impossible to ship scallops, dealing a grave blow to the industry.
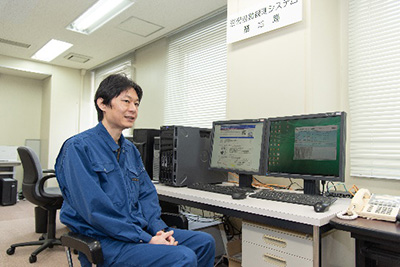
In order to protect the fishing industry from such critical marine conditions, the Aomori Prefectural Industrial Technology Center provides information in real time of the sea conditions using data from buoys placed on the Mutsu Bay, and monitoring data from the climate change observation satellite SHIKISAI.
We spoke with Yuki Kosaka, Director of Aomori Prefectural Industrial Technology Research Center.
Yuki Kosaka
Aomori Prefectural Industrial Technology Research Center, Fisheries Research Institute, Fisheries Ground Environment Section
1996: Graduated from Tokyo University of Fisheries.
Entered Aomori Prefectural Fisheries Experimental Station.
2001: Started work at Mutsu Fisheries Office
2004: Joined Aquaculture Research Institute (currently Fisheries Research Institute).
Current research is focused on fishing ground environment and has been studying shellfish poison for many years.
Achievements include developing Aomori Prefectural Meteorological Information System "Umi Navi @ Aomori" and Aomori Prefecture's own water temperature prediction model.
Protecting scallops by monitoring marine conditions

- Could you describe the impact of the abnormally high seawater temperatures that triggered the use of satellite data in 2010?
KOSAKA: Aomori Prefecture’s fisheries industry is very large, worth around 50 billion Japanese yen in total, of which scallops is at the top, worth between 10 to 20 billion. But in 2010, scallop farming output (in weight) dropped drastically to a third, and production (by value) to less than a half, due to the abnormally high seawater temperatures, devastating the local fishing economy.
In some places the scallops were virtually wiped out. The scallops also spawned less than usual, which was really traumatic for fishermen. Scallops prefer colder waters, and Mutsu Bay is close to the upper limit of what they can tolerate. The seawater temperature averages around 23 °C(73.4°F) which is “hot” for scallops. The 26°C(78.8°F) record of year 2010 , would feel like 40°C(104°F) in human terms.
In response, we established a framework for rapidly analyzing and delivering information. We not only increased the number of buoys that monitor seawater temperatures which have been operating in Mutsu Bay for over 40 years, but we also utilized the data from both the buoys and the observation satellite to develop a water temperature prediction model so as to rapidly analyze the information. We designed our own system called “Uminavi@Aomori”, which serves as a comprehensive source of information on marine and meteorological conditions in Aomori Prefecture. This system provides fishery operators with analysis on water temperature change and wave forecasts.
- Could you describe key characteristics that caused such fluctuations in seawater temperature of Mutsu Bay?
KOSAKA: One is the influence of the waters entering Mutsu Bay from the open sea. The Japan Sea forms a warm current, so warm waters enter the bay from the Japan Sea side. Plus, Mutsu Bay is a closed body of water, so when the sun is shining, the temperature steadily rises under the effect of solar radiation. Satellite data clearly shows how far the warm water has come. It’s a valuable research tool that can also be used for prediction.
- So satellite data is being used to protect the fishing industry.
KOSAKA: Exactly. It’s already being used to analyze what effect water temperature distribution could have down the road. We tell fishery operators, “The satellite shows that water temperatures here in the Japan Sea are fairly high, so be on your guard.”
-Could you tell us more about the water temperature change prediction research?
KOSAKA: We undertook the research and development of predicting water temperature changes in the aftermath of the abnormally high seawater temperatures. In the process we came to realize that air temperature and water temperature don’t necessarily match. The environment of Mutsu Bay is rather unusual in that even though air temperatures taken on land is high, it is not always reflected in the water temperature. For example, when the cold easterly wind known as the Yamase is blowing, even if the temperature is high in Aomori City, it might still be extremely cold in Mutsu Bay. So it’s important to know the temperature of the seawater itself.
Satellites have the advantage of visualizing a wide area, so that data can be obtained from wherever upstream locations that seem most relevant. There have been buoys on Mutsu Bay monitoring water temperature for over 40 years, but it is limited to just three locations. So having a satellite is very handy because it lets you check a huge number of locations at the same time.
The waters of Mutsu Bay in fact flow downstream from Niigata Prefecture located in central Japan, and air temperature forecasts for Niigata, surprisingly, match those for Aomori a fortnight or a month later. That suggests that the accuracy of one-month forecasts could be increased if you knew the water temperature off the coast of Niigata. So knowing water temperatures on a broader, nationwide scale could lead to higher accuracy of forecasts.
- What led to the use of the climate change observation satellite SHIKISAI (GCOM-C) as your data source for seawater temperature?
Kosaka: We were using a website called JAXA Satellite Monitoring for Environmental Studies (JASMES), through which JAXA makes available satellite data. In March 2019 they switched from overseas satellite data to the current data from SHIKISAI. So we spent about two months creating a program while drawing on the know-how we’d previously applied to collecting overseas satellite data.
- Could you describe the merits of switching over to data from SHIKISAI?
KOSAKA: The resolution was completely different, and so much better than we’d expected. Conventional satellites offer a resolution of one kilometer, versus 250 meters for SHIKISAI. That 250-meter resolution is invaluable for scallop farming.
- What is the connection between resolution and scallop farming?
KOSAKA: You can gain extremely important information about coastal areas. Aquaculture in Mutsu Bay hugs the coastline. Conventional satellite data has a resolution of one kilometer, so due to the effects of topography, both land and sea information gets jumbled together in coastline data. That can render as much as a kilometer’s worth of data invalid. With the 250-meter resolution offered by SHIKISAI, less data is lost, and you can literally see the water temperature in aquaculture zones.
- What action is taken if water temperature data indicates that the environment is no longer safe for scallops?
KOSAKA: If the forecast is for fairly high temperatures, one option is to ship the scallops early. Some scallops may still be growing, though, and not ready for shipping. Now, water tends to be warmer on the surface and cooler below, especially in summer. Warmer water has a lower density and so rises to the surface. So what you can do is place the scallops deeper down in the water before they’re harmed. If they’re too deep down, though, there won’t be enough plankton for them to feed on, and that will stunt their growth. So it’s a tricky task. You have to strike the right balance. To avoid placing stress on the scallops, it’s also important not to move them.
-Are there any other merits of data from SHIKISAI?
KOSAKA: The overseas satellites we used before was not easy to use because of the data format and a problem of having many error values. So we compared the data taken for about one year from the start of data distribution of SHIKISAI and compared it with actual measured values from buoys at the end of 2019. It turned out that the SHIKISAI data and buoy data matched really well. It was on the level that it could be used as an actual measurement, so we plan to continue using it into the future.
-Could you tell us more about the water temperature prediction model using satellite data. What has been done and what are your future plans?
KOSAKA: Since 2011, we’ve been working on two research projects on heatwaves and abnormally high water temperatures. The first is a joint project with the Tohoku National Fisheries Research Institute, a branch of the Japan Fisheries Research and Education Agency, and other participating prefectures. This involves constructing an autoregressive model based on past water temperature patterns and making forecasts by extrapolating them into the future. We’re building a second model on our own. This is the Applied Meteorology Model, which factors in temperature forecasts from the seven-day weather forecast. By combining these two models in making forecasts, we’ve managed to improve short-term accuracy to some extent.
Uminavi@Aomori plans to extend the range of its forecasts to a month and a half. Based on data for the past 30 years, the system will determine automatically, by applying AI, which time period is the best fit for forecasting, and send out the forecast that is the best match.
-Since you started using the satellite data, have you had any reactions from people who actually work in the fisheries industry?
KOSAKA: Young people are big users of data. There are many that use data other than Uminavi@Aomori. Data, I think, needs to be reduced to simple graphs or numbers so users can get the most out of it. For example, I think that at least indicating the surface water temperature as a number for locations without a buoy, is necessary.
On the other hand, there are those who simply just want to check the water temperature. A lot of people are interested very specifically in the water temperature at a depth of between 15 and 20 meters, which is essential to know for scallop farming. So we’ve created a webpage that brings together precisely that. People also want to know how conditions compare to those in 2010, when water temperatures were abnormally high. So, besides a graph comparing temperatures to the previous year, we’ve also included comparisons with 2010.
- What other applications are there for SHIKISAI data in the Aomori fisheries industry?
KOSAKA: Well, it can be also used during spawning season for scallops, which is around February. Spawning begins when the warm current flows in, raising water temperatures. Last year, when our scallop expert mentioned that the scallops appeared to be spawning, we looked at the satellite data and used it to make a small observation: the water temperature was a bit high, and that might be having an effect here. In one place, it seemed, a very small amount of spawning had taken place in early February, while the water temperature was still low. The satellite data suggested that this phenomenon was highly localized. And in fact scallop larvae were not distributed over a very large range. Therefore, satellite data is also valuable for determining that spawning is taking place over just a limited area.
-In the long term, what role do you expect the SHIKISAI satellite to play in monitoring the marine environment by the Fisheries Research Institute?
KOSAKA: One form of long-term environmental change is the so-called global warming. I’ve been monitoring buoys for a long time, and while I can’t yet say for sure, the overall trend seems to be toward rising water temperatures. There’s very little data available for a broader area, especially the open sea. We therefore have the highest hopes of SHIKISAI as a means of tracking long-term increases in water temperature.
In addition, once we accumulate enough data, we can calculate temperatures for an average year and evaluate actual temperatures against them to determine whether they’re higher or lower. That allows you to consider your options. For example, if water temperature is higher than average in a particular year, you can expect to catch warm-water fish; if, conversely, you can’t expect that, you can switch to other species of fish instead. For that we need to have at least five to ten year worth of data. We expect to have a steady supply of data for the mid to long term.
Interview and article by Ayano Akiyama
Published March 30, 2020